Mike and Kyle were responsible for getting the Raspberry Pi, and Ultra Sonic Distance Sensors working. They wrote the scripts in order for this to be successful. Haley was responsible for creating the logo, graphics, color pallete, web app construction, demo parking lot for the installation and the creation of this documentation site.
Lot Meter from Haley Kershaw on Vimeo.
This is designed in a way that is easy for the user to navigate. The buttons are helpful and the appropriate size. The colors are too vibrant and distract from the easy navigation. There are helpful sorting options. This app is designed to help the user find affordable parking in cities.
Very similar to bestparking.com because both compare prices and show locations of various parking lots. I like how parkme.com has a simpler layout. This site includes photos. I would like to use vector illustrations in replace of photos for our project. Since the users will already be familiar with Kutztown I do not think a photos and Google maps will be necessary.
This is designed for business owners. For example if you own a restaurant in a location where it is hard to find parking they offer this app to personalize a map suggesting parking that you can link to your website. I was not able to get this app to work. The map wouldn’t load to the locations I entered.
This is a product that tracks traffic patterns. This product collects video and the video is transferred into data after uploading it to their website site and waiting a week for the company to email you back a spreadsheet of data. Their prices are high.
Sen Source talks about the use of people counters in retail. Stores have devices that count when individuals enter and exit their store. This provides the store with information that can help improve sales. This site also had information on vehicle counters.
This app has a feature called Venu Vibes that tells you if a restaurant is busy or not. The purpose is to help you avoid crowds. There are four breakdowns: lively, active, relaxed, quiet. This app has a social aspect included where you can split the dinner bill with a friend and pay with apple pay. Under reviews people said their favorite part about the app was the declaration on how busy the restaurant was. They did not like the logo. This app is designed beautifully. It only works in certain cities. It told me that I was not in a Dash city.

Since the sensor is the start of the system, all data will begin here. As soon as the sensor gets tripped by an obstruction, data is captured via the trigger wire and is transmitted back to the raspberry pi which is the processing center of our system. That piece of data gets processed by the programming code our team writes and then gets sent to the server for use on the web application. Once the server has received the data, that means it is ready to be sent to the web application. This happens within a matter of milliseconds due to our design of having the sensor, server, and web application connected in one single chain. This means no transmission delay, no buffering delay, and certainly no bottleneck.

Once the data reaches the web application, its journey is over. The data gets converted over to a graphical image using code from our team and is then presented to the user through their internet browser. Once it is seen in the internet browser in real time, the data is essentially reached its lifetime and will be cleaned up to save space.

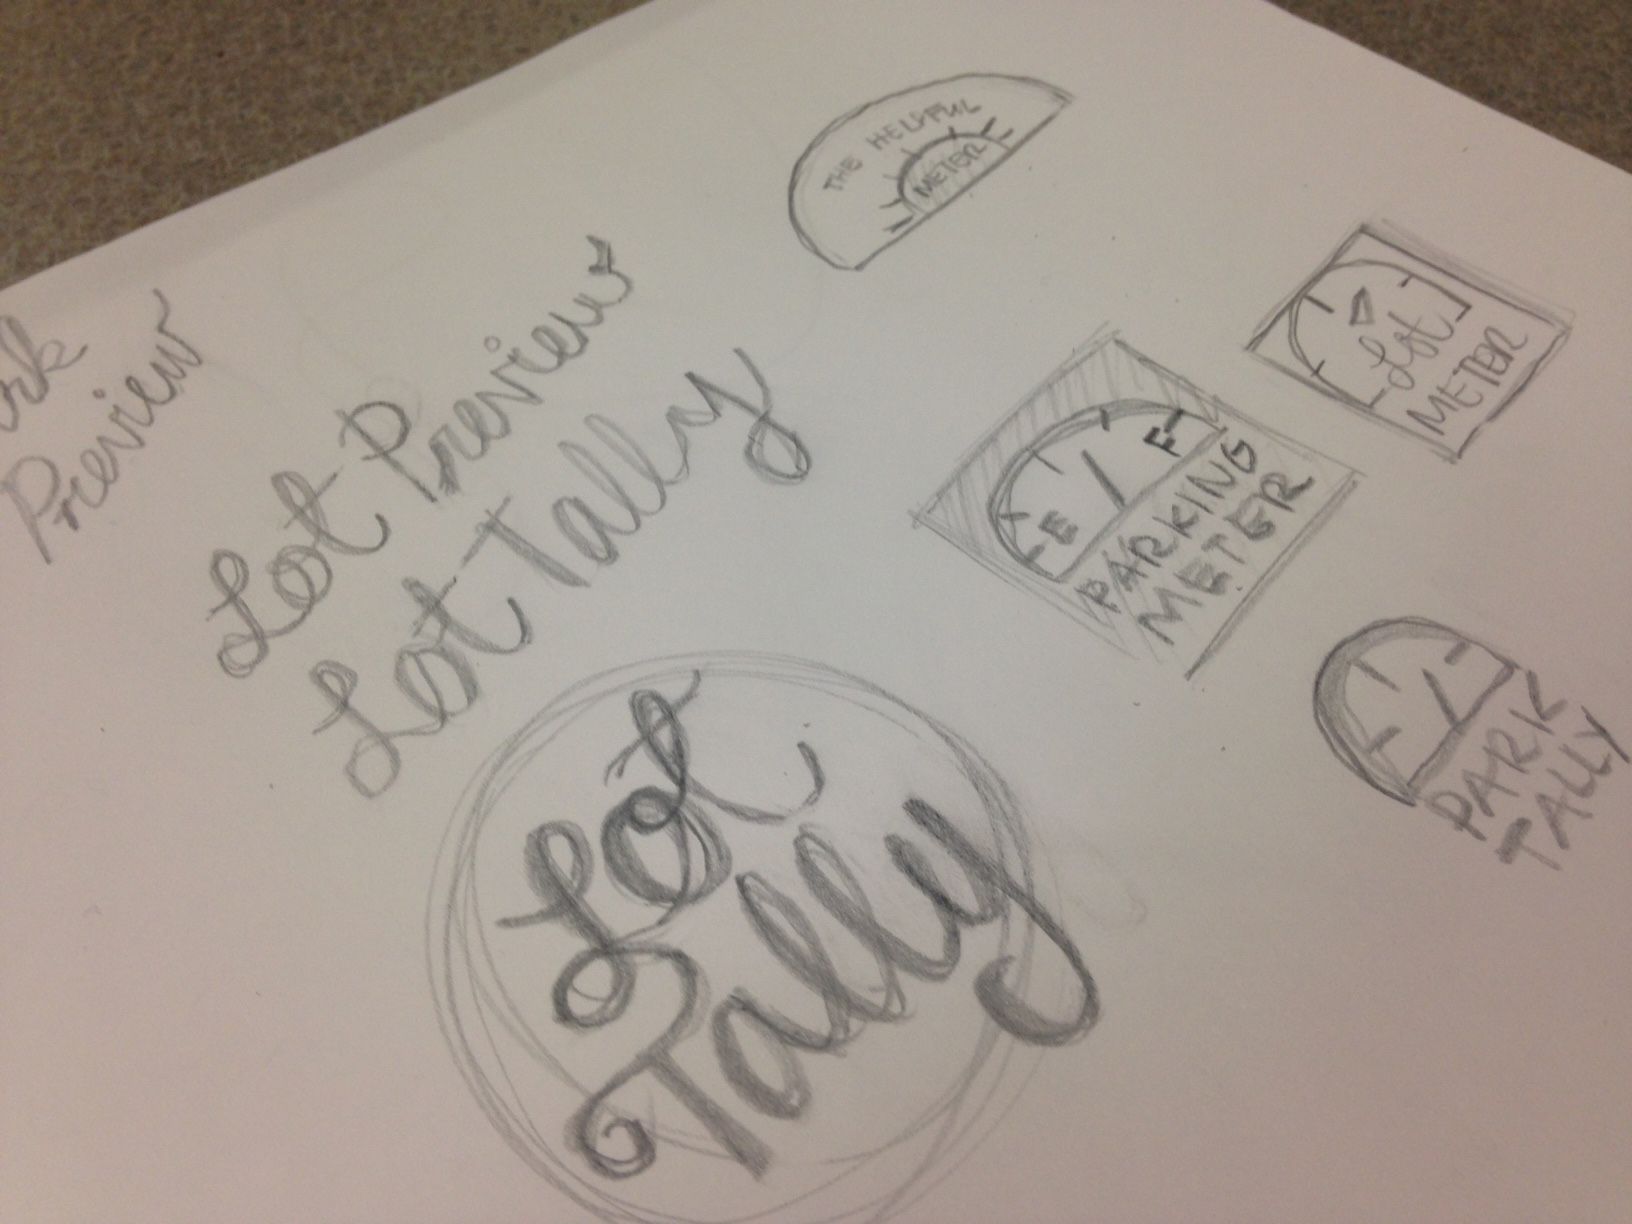
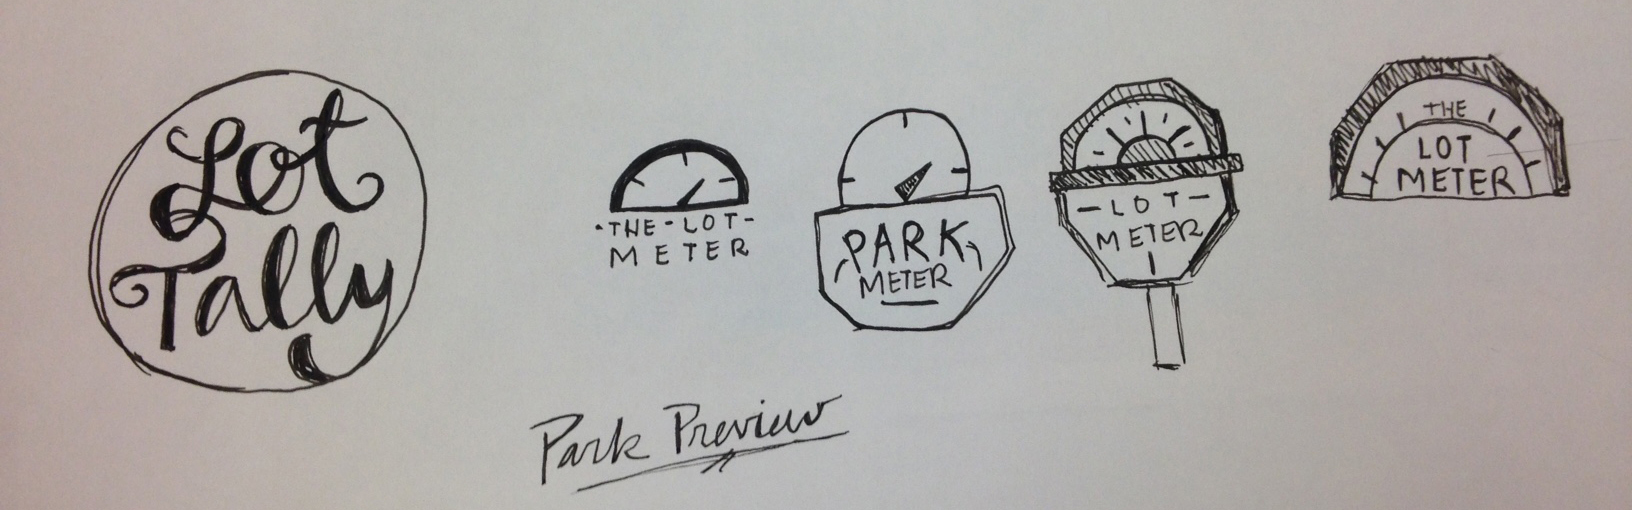


Originally the logo was modeled after a parking meter. This made the viewers think that the app could be used to pay for a parking. Since this is not the case the logo had to be rethought. Now the logo resembles a gas gauge. This makes more sense and still sticks with the car theme.
The deployment diagram, represents our system as a whole. The car will represent the actual vehicle crossing the sensor which will push data from the sensor to the web server. The node titled Data (Ultrasonic Sensor) is responsible for the physical sensor and the data being gathered from said mechanism. The sensor will send an ultrasound out and back and record the distance in real time. The system being implemented will utilize two sensors. Three sensors is to illustrate that each car must pass a sensor either on the way in the lot or on the way out of the lot in order to accurately track data. The data from the sensors will be put to the web server where it will be held until its retrieval by the web application. Continuing from the web server the information waiting will be put to a web application where the user will be able to view the data pertaining to the specific lot he/she is interested in. The end user will be knowledgeable of the web application, however the behind the scenes sensors and equipment will not be a concern for them. All other equipment for the system will be handled by the implementers and system designers. The web server with all of our HTML files will be managed by using SSH and FTP through a remote device by our programming team. Since the Raspberry Pi has that feature available, our team decided that using a remote device would be much easier than managing right from the Raspberry Pi.

The structure of our system is focused around one important file. The CountScript.py Pythonfile is our main file and acts as the main process to run our system. What this script will do is import libraries, initialize variables, run the setup, and then collect data. The libraries that are necessary for this script are the Rpi.GPIO library which includes all the code we will need to setup the GPIO pins on the Raspberry Pi and the time library for recording the time of each measurement. For the variable initializations, the sensor requires one variable to act as the trigger and the other variable to act as the echo. These variables are integer values that map to the values given on the Raspberry Pi. Once the variables are declared with the proper value, the setup function from the Rpi.GPIO library is called with the variables passed as arguments. This function pairs the wires between both devices so they can communicate. A sleep buffer must be included between these steps so that the sensor has time to settle. Once a couple milliseconds pass, the paired devices can start collecting input. Lastly in the script file is the collection of data. For both the input and output sections there will be a time interval set for the control loop so that the data is collected until that time interval is met.


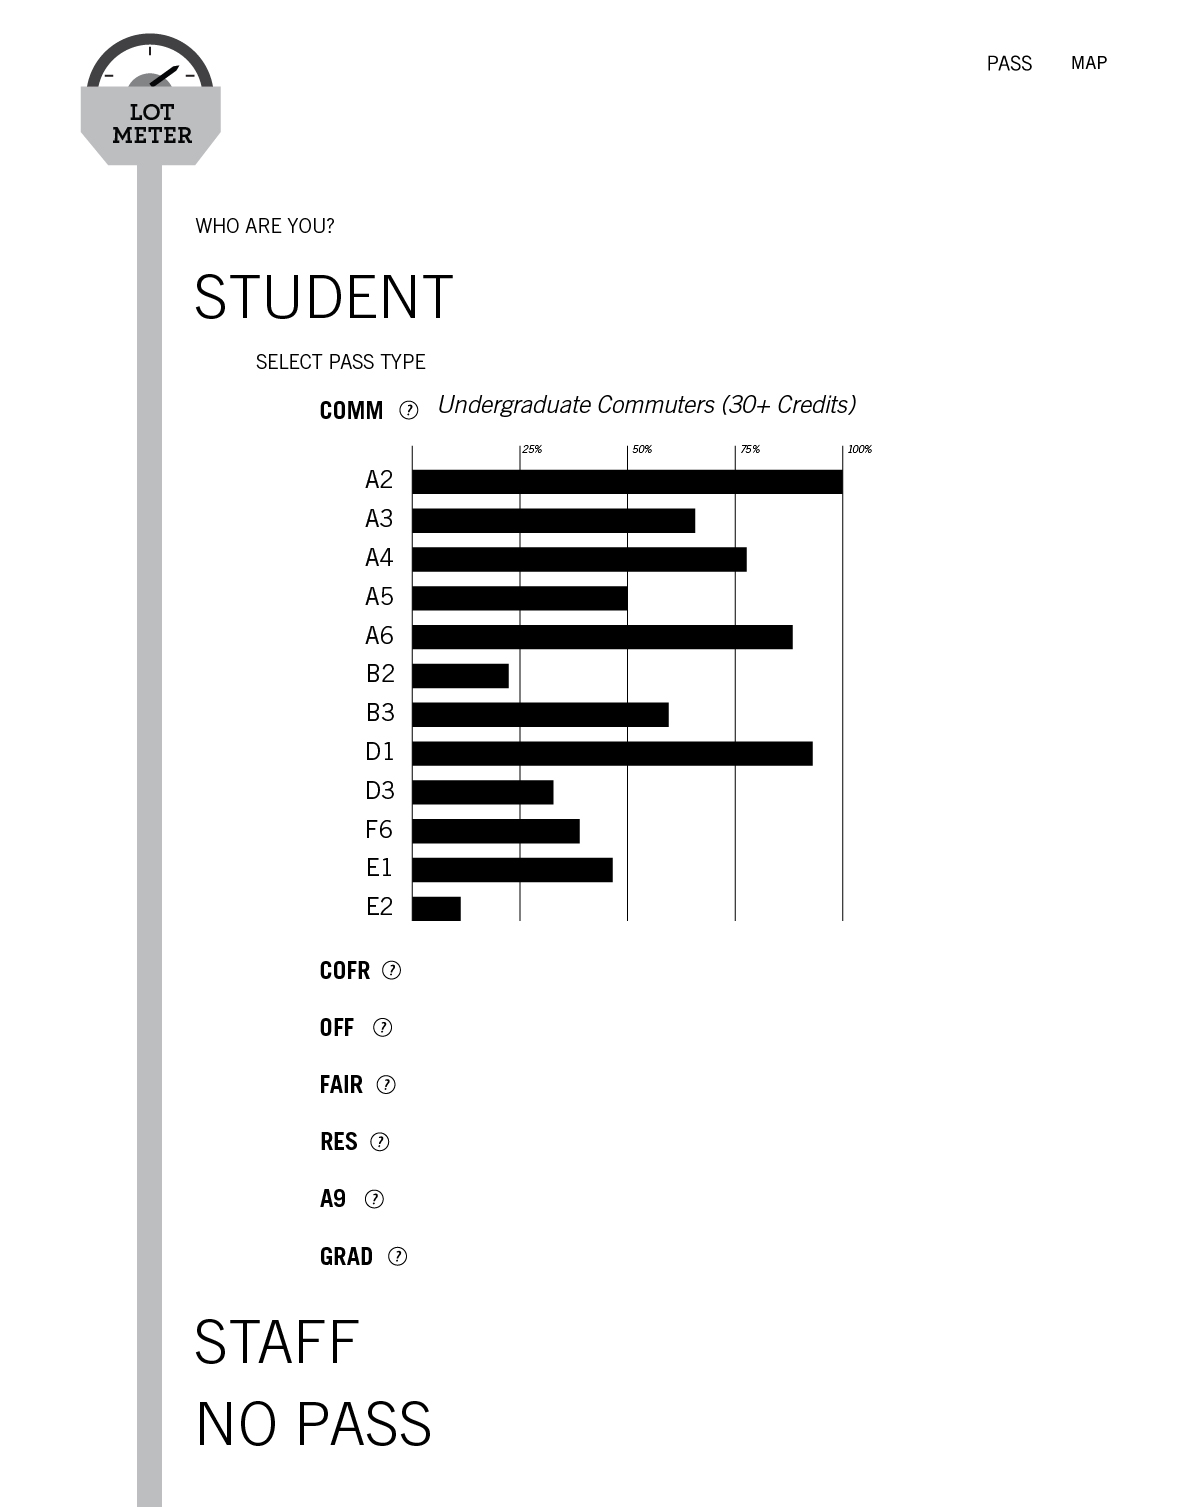


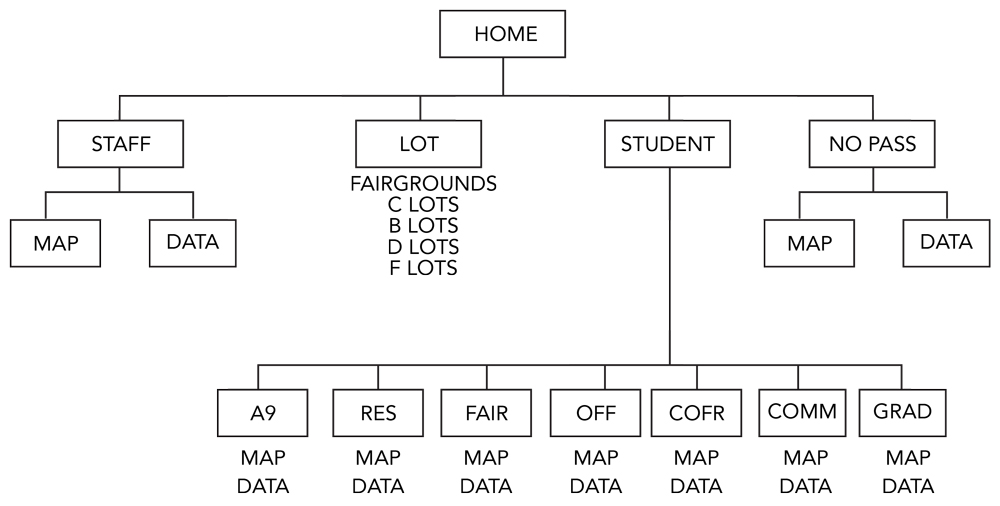
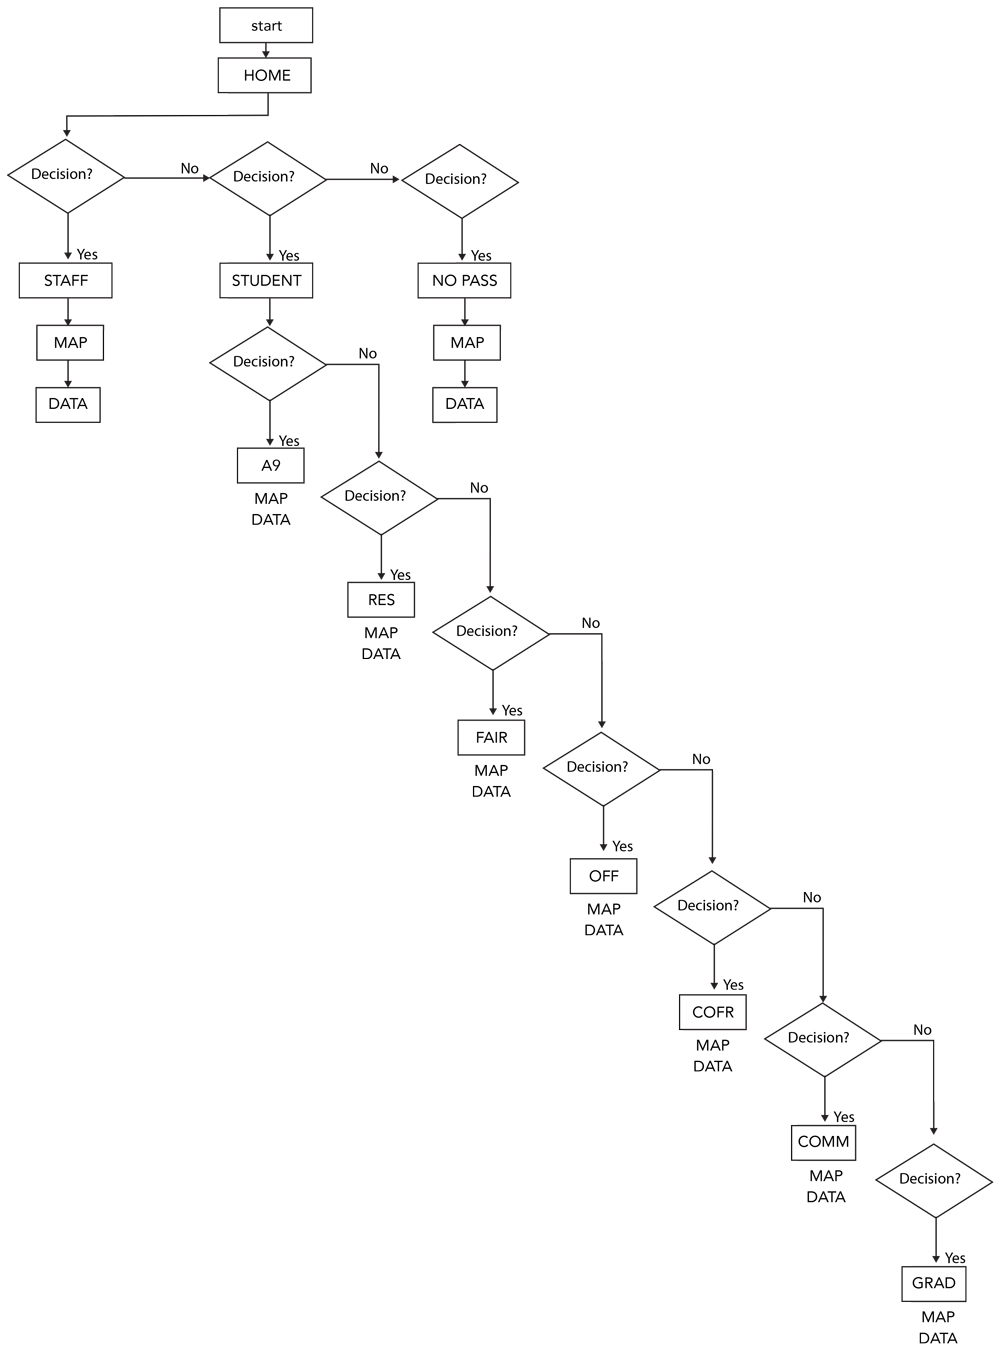
Presented when you first visit our site, the home page displays the title of our project as well as lists options on how you would like to navigate through our site. The three options are student, staff, and visitor. Each correspond to the types of users who may access our site. Since our site is intended for those attend, work or visit the university, we have accounted for all users entering our site.
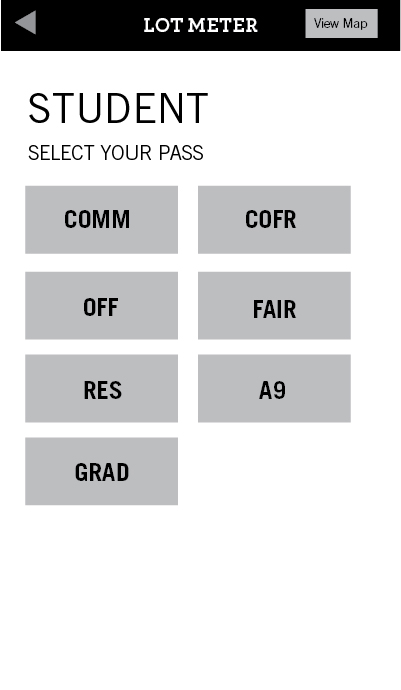
If you are a student, and click student the next page will present you with another list of options. This list shows all parking permits acquirable through Kutztown. Click on the one that applies to you. This final page will show you a responsive bar graph of all the lots at Kutztown University that your specific pass can park in. The state of the bar graph will solely depend on the sensors and how full each lot is. If this view is not ideal, we also have a link in the top right corner which will navigate you to a page which displays a birds eye map of the campus. The campus has labeled all the lots and again, only the lots that you are allowed to park in would be colored. These lots are then color coded to change based on the current availability of parking. Other lots will be the default gray.
If you are staff, and click staff the next page will show you a responsive bar graph of all the lots at Kutztown University that shows the specific lots you can park in. The state of the bar graph will solely depend on the sensors and how full each lot is. If this view is not preferred, select the link in the top right corner which will navigate you to a campus color coded map.
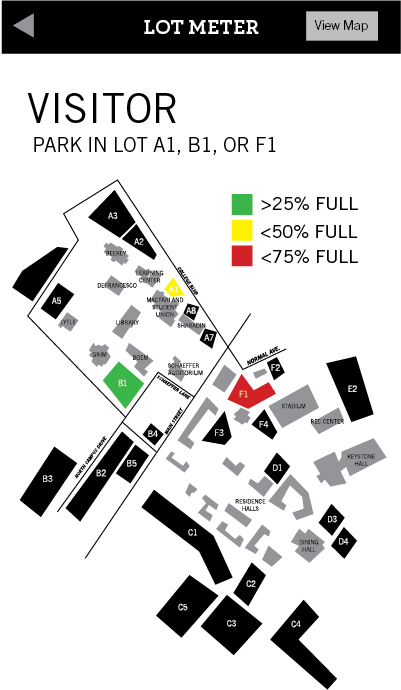
If you are a visitor, and click visitor you will go to the visitor map. This map again has the color coded availability. The color palette follows the conventions of a stop light. Green is good, I'm certain you'll find a spot. Yellow means slow down it will take you a little longer to find a spot. And red, well no one likes red. A red lot is pretty full.
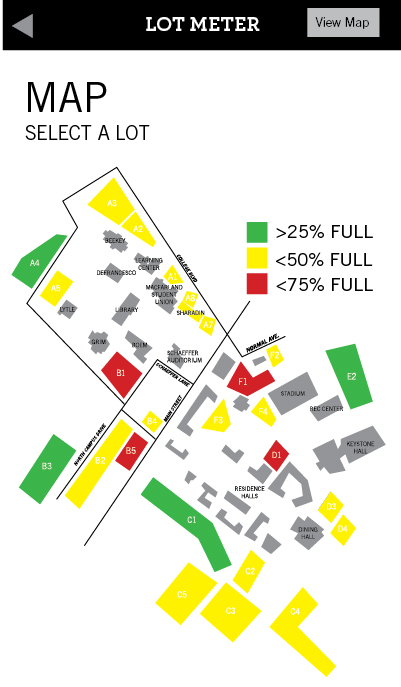
Located in the top right corner of the screen, there is a button for the general map. When clicked, this map has labeled all the lots associated with Kutztown University. All the lots are color coded on this screen to change based on the current availability of parking. This was created as a SVG in Illustrator.
We wanted to have the sensors set up to record indiduals entering and exiting a room. After user testing the team realized the sensors were unable to do so reliably. Some people walk at different speeds. Some walk with their arms swinging. Some are small, and some are not. We could not counter react all of these variables. So we switched our demo method. Instead of measuring people's movement in and out of the gallery demonstration we set up the demo table top parking lot. We were able to control the speed and size of the cars. After testing this idea we concluded this was the most accurate and successful way to demo our app.
The next step would be to get this app working in a parking lot. Right now the app is only working in the demo tabletop set up. Looking into the future, our system could be scaled to a much bigger system. Not only could this system be applied to Kutztown but other universities.